Zenyatta Ventures: Undervalued High Purity Graphite Play
Article originally posted on Seeking Alpha.
—
Summary
- PEA proves low cost per tonne with significant profit margins at Albany deposit.
- End user interest and commitments should begin to surface soon.
- Vast differences exist between amorphous, flake, hydrothermal, and synthetic graphite.
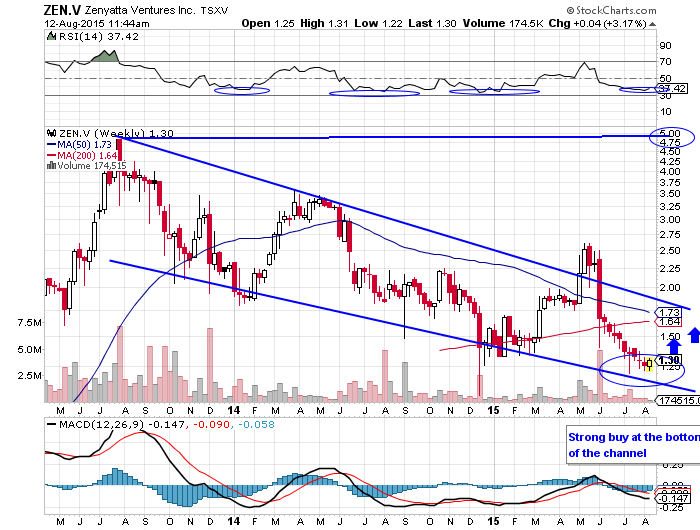
- Share price hasn’t traded this low since early 2013, even through webtrader.
I believe that Zenyatta Ventures (OTCQX:ZENYF) found something very unique, special, and valuable at their Albany deposit in Ontario, Canada. There are simply a ton of misgivings and false information circulating the graphite sector. Admittedly, I have experienced quite a learning curve to absorb this seemingly complex form of carbon that nature gave us. Today, I want to dig more into the economics and new information Zenyatta’s recent PEA filing gave us to put fresh analysis on the company and share price. But before we do that, let’s spend some time clarifying the similarities and differences between the types of graphite out there and compare it to what Zenyatta has at Albany. This is a very important exercise.
If you don’t like Zenyatta that is more than fine, but after reading my analysis, none of my readers should be heavily invested (or better yet-invested AT ALL) in flake graphite companies….period. As you’ll see, not only is flake graphite plentiful throughout the earth, the supply coming into the market will likely crush prices. Luckily, Zenyatta will be competing exclusively in the high purity synthetic graphite market, which is 15 times larger than the flake market and is not correlated with flake graphite prices. Synthetic/hydrothermal graphite and flake graphite markets and pricing are different and not highly correlated whatsoever. Minimally, people need to stop comparing flake graphite companies to Zenyatta! It is like comparing economics of a lead mine to a gold mine. Yes, they are that different!
Here is how GMP Securities describes Zenyatta’s graphite:
Zenyatta is focused on developing the largest known hydrothermal graphite deposit in the world. The Albany deposit is a unique hydrothermally derived graphite deposit; the purest naturally occurring form of graphite. Indications are that Zenyatta’s graphite could compete with the highest purity type of graphite, synthetic graphite, resulting in revenue per tonne at the highest end of the graphite price range (Source).”
Zenyatta Ventures describes itself as having the world’s “largest and only high purity hydrothermal graphite deposit being developed in the world.”
Types of Graphite
Somewhat simplified, there are three (3) different processes leading to the formation of graphite deposits. Natural graphite material has varying levels of quality depending on the type (amorphous, flake or hydrothermal). The degree of purity can vary greatly, which heavily influences the use of the material in applications and its pricing:
1. Amorphous (Sedimentary) graphite is derived from the metamorphism of coal deposits. Graphite formed under these conditions is characterized by incomplete structural ordering, abundant impurities and low crystallization, resulting in low value “amorphous” graphite with its main market in foundry applications. Amorphous applications include old school pencils. Prices for amorphous graphite are quite low at around $500 per tonne.
2. Flake (Sedimentary) graphite is the metamorphism of organic material and is very common. The formation of these deposits involves sedimentation and then alteration of carbonaceous organic matter to graphite during regional metamorphism. This graphite contains abundant impurities. Upgrading of graphite from this deposit type is complex and costly as a result of processing using aggressive acids and/or thermal treatment.
3. Hydrothermal (volcanic) graphite deposits are very rare. The formation of these deposits is associated with migrating supercritical carbon-bearing (C-O-H) fluids or fluid-rich magmas associated with volcanic activity. The formation of the carbon-bearing fluids is most often a consequence of high temperature metamorphism, but magmatic degassing can also produce graphite. Fluid precipitated graphite is well-ordered and can be a source of highly valued crystalline or vein-type graphite.
The Albany graphite deposit is a unique example of a hydrothermal graphite deposit in which a large volume of highly crystalline, fluid-deposited graphite occurs within a volcanic host rock. Says Dr. Andrew Conly from Lakehead University:
Evidence has shown that Zenyatta has discovered a unique sub-class of a hydrothermal graphite deposit unlike any other. Igneous breccia-hosted graphite deposits like Albany are very rare, and to the best of my knowledge, none are currently being mined or even in an advanced stage of exploration globally. Our on-going research of the Albany deposit will establish the first genetic model for this distinctive type of graphite.”
In contrast to more commonly occurring flake and amorphous graphite deposits, the unusual hydrothermal style in the Albany deposit can be processed, at a cost advantage, to yield high purity, crystalline graphite ideally suited for advanced high-tech applications. The world trend is to develop products for technological applications that need extraordinary performance using ultra-high purity graphite powder at an affordable cost. High purity is gaining prominence at a time when Zenyatta discovered a very rare, (hydrothermal) graphite deposit, which can be upgraded to >99.9% carbon (‘C’) with very good crystallinity without the use of aggressive acids and high thermal treatment. The development of this deposit would place Zenyatta in a strong position to compete in specialised markets such as those currently supplied by high-cost synthetic graphite. When combined with a large, discrete ultra-high purity graphite deposit and the growth potential of these markets, the substantial potential of the Albany graphite deposit becomes quite evident.”
Flake Graphite Pricing
Flake and amorphous graphite deposits are abundant globally as witnessed by the many companies that own flake graphite deposits. These types of graphite deposits are located on every continent and are huge. Flake Graphite prices have been under pressure lately with 94-97% C +80 mesh dropping 21% from $1227/tonne in Q4 2014 to $967/tonne as of summer 2015 FOB Qingdao China. This decline is a result of weak demand out of China and Europe and the strength of the American dollar. The decline has occurred in spite of reduced supply out of China stemming from the Chinese government’s effort to clean up archaic and dirty mining operations.
The price decline seen recently has taken the pricing deck of flake graphite down 32% to 4-year lows. Clearly, there is no shortage of supply of flake graphite in today’s market, and the potential for declining prices in the future is very significant. This is because of the avalanche of new supply that is planned by the many flake companies with mines in development.
The current (and VERY well supplied) global flake graphite market is about 500,000 tonnes of consumption per year. If you take the flake graphite mining operations that have advanced to the engineered economic evaluation stage (that we know of), the total planned production from these mines is over 1 million tonnes per year. I doubt all will make it into production but even one new mine will have a very significant negative effect on flake graphite pricing. One African-based deposit alone (one of the most advanced mines in development) is modeling sales of 356,000 tonnes per year (tpy) into a market of 500,000 tpy. Clearly this won’t happen without a severe decline in flake graphite pricing from current levels. This will be very problematic for planned producers. Many have current models that assume $1500/tonne pricing for 94-97% C.
It is important to understand that there is no shortage of flake graphite deposits in the world. The geological zone hosting graphite in Mozambique, Tanzania, and Madagascar is massive. There are literally billions of tonnes of flake graphite available for development. Lastly, the entire market size in terms of dollars for most flake graphite applications is only $1 Billion annually versus high purity synthetic graphite which is nearly $15 Billion and growing.
Synthetic and Hydrothermal Graphite
Zenyatta’s hydrothermal high-purity graphite will almost exclusively compete in the synthetic graphite market. It is indeed true that flake graphite can be purified to 99.9% plus through the use of thermal treatment or very aggressive acids. Cost is the main issue with thermal treatment, with costs similar to that of synthetic graphite. Many high tech applications simply will not use the graphite made if strong concentrations of acids were used in the purification process, which creates inferior brittleness amongst other negative attributes.
So why is Zenyatta going to have any advantage when trying to sell their end product up against other synthetic graphite, even if the quality is similar? Cost and environmental advantage. I can guarantee you that no synthetic graphite producer can make their end product at a cost below or even near $2,046 per tonne as was reported in the recent PEA. And, Zenyatta’s actual cost could drop towards $1,700 per tonne as we get to feasibility stage. Environmental advantage as outlined by GMP:
The complete environmental footprint of the Albany Deposit benefits from its hydrothermal graphite which can be concentrated using conventional methods and purified using a caustic bake process flow sheet which has much less environmental impact than the alternatives. Other types of graphite are upgraded using hydrofluoric acid or very high temperature roasting. The use of conventional and environmentally friendly processing at Albany would be attractive for end users who are increasingly demanding full environmental product stewardship” (this is increasingly becoming a big deal to end users).
To me, the 30,000 annual tonnes sold that are modeled into the PEA is likely going to end up being conservative. It doesn’t take more than potentially 4-6 customers to absorb that amount on an annual basis, and we are going to be selling into high growth markets like lithium ion batteries, fuel cells, powdered applications, nuclear, and future dynamic markets that are just beginning to surface like sintered metals. This is important because I believe the bar has been set low by Zenyatta and RPA in the PEA and the economics will improve substantially into the pre-feasibility stage. Into feasibility, the true economics will likely improve even further, and the estimates in all key areas have been conservative up to this point.
So, I do not think Zenyatta will have any trouble selling their product at a minimum of $7,500 per tonne at 30,000 tonnes per year. In fact, we may see the average selling price climb in addition to the tonnage. Even though the profit margins are substantial as is, we should see them expand into pre-feasibility, which should be finished by the end of Q1 2016. The pre-feasibility study should kick off quite soon and due to the exhaustive amount of work done for the PEA, will be completed in approximately 6 months (I call it 8 months to be safe). If the PEA is taken at face value (again, RPA I believe, was incredibly conservative in virtually all areas of study), Albany will surely become a mine, and a very profitable one at that. For those that haven’t seen it, you can review the numbers here.
It can be argued but it is my opinion that the NPV (Net Present Value) at this stage should be at an 8% discount versus 10%. Even so, we will definitely look at the 8% discount numbers upon pre-feasibility in 6-8 months which gives us an almost $600 Million net present value (this is US dollars, so that is over $700 Million CDN). There are a few other key factors to keep in mind as the company gets through pre-feasibility. Two areas that RPA were too conservative on were that they did not use the underground resource, which reduced the life of mine to 22 years from what is well over 30 years using the entire proven resource (this should add close to $100 million plus to the NPV at an 8% discount rate). Additionally, they padded contingencies of 24%, which is quite high, leaving room for a $30MM reduction, or in essence another addition to the NPV. So, keep in mind that by the end of Q1 2016, Zenyatta’s Albany deposit will very likely see an after tax net present value of nearly $730,000,000 US (just moving the discount rate to 8% versus 10% alone brings us to nearly $600MM). Keep in mind, this should also take the internal rate of return (IRR) to nearly 40-45%.
I zero in on this because at that stage, Zenyatta’s share price should be trading at minimally 1/3 of its NPV. Let’s use just $700MM US or $875,000,000 as of August 2015’s conversion rate. That gives us a $291,000,000 market cap for the company. Currently, we are trading at less than one third that value! Tack on 5 million to the shares outstanding to cushion for a capital raise of approximately $5MM, and we should have a stock trading near $4.50 per share by early 2016… minimum. And remember, as the company moves forward from pre-feasibility to feasibility stage, the discount rate drops even further. At feasibility stage, a 5% discount will be appropriate and trading value near 50% of NPV means we have a low-double digit stock in Zenyatta Ventures.
If there is any one negative that sticks out to people from the PEA, it is that capital costs (CapEx) came in higher than we all expected. However, I am very confident that just a more reasonable contingency percentage brings the number into the high $300s. Additionally, once more accurate numbers are sourced on supplies, etc. my work shows the pre-feasibility stage CapEx should decline to the $300-$340MM range. This is not very high when you consider that this is a project that will likely show cash flow of over $120MM after taxes for over 30 years, probably higher and longer.
As far as financing steps, on August 16th Zenyatta closed on $2.1MM mostly from existing accredited and institutional shareholders. This will put them well on their way to either move toward pre-feasibility stage completion or refreshing the PEA. Also, it is likely that the company will receive another $2MM by December 15th of this year from the exercising of in the money stock options (expiration is December 15th – 900,000 options exercisable @ 60 cents and 1 million at $1.50). After this, we should see somewhat typical stages of financing as most mining companies that move closer to a production decision. The bankable feasibility stage will likely be funded by another equity offering or perhaps a development partner of some sort could surface. Keep in mind that either of these scenarios could result in significant dilution. The Canadian government has been very supportive of the Albany project and we’ve seen them pledge money via grant in the past.
I don’t believe that the company will take the project into production by themselves. Either a buyer or partner will surface as more “bankable” data is produced. Then, at the bankable feasibility stage, debt/bank financing for the bulk of the capital expenditures is likely. There is also the possibility of a much smaller pilot plant of sorts that would produce revenues and allow for buildout in stages. My belief is that Zenyatta is a strong take-out candidate as they move the project past feasibility stage. The PEA fulfilled its purpose to move towards the next step of pre-feasibility because the economics clearly merit moving forward. Zenyatta will likely have to either raise a lot of money and/or give away a chunk of their equity to a development partner that could bankroll mine build out (either potentially generating shareholder dilution-unless a partner finances early to lock in cheap prices as a future customer).
In summary, Zenyatta is extremely undervalued at current prices. The Albany project has been de-risked tremendously since we initially got involved in 2012 and since the stock hit $5 in 2013. There is no better way to invest in and own exposure in the growing high purity graphite marketplace. Economics will only improve, not decline, going forward into the pre-feasibility stage of development.
As you see in the chart below, the company is now trading right near the bottom of its weekly trading channel. Predictably, we should see a bounce back to the top of the channel near $2 at a minimum from current prices in the $1.30s; this alone is a 70% plus gain. The next step is a break upwards of this very long-term flagging pattern, which will confirm a move to retest the previous highs of $5. In May, we saw a “bull trap” when the stock broke above this channel, but did not hold above it. I contend that the next breach of the top line will be the real deal as fundamentals continue to improve and off take agreements with blue chip companies are signed.
I expect a test of $2 no later than year-end 2015 and more likely sometime by the end of September or early October. Long-term investors may want to accumulate a large position near this bottom test of a predictable trading pattern in Zenyatta for superior returns.
This news just in (August 12th) on collaboration between Zenyatta and Ballard Power on fuel cell applications:
Ballard testing confirmed very unique properties of Zenyatta’s high purity graphite. I expect more 3rd party verification and feedback in the coming months. News release highlights:
- Zenyatta graphite exhibits high thermal stability and corrosion resistance under Ballard testing;
- Early testing shows Albany graphite to be suitable for BPP and GDL fuel cell components;
- Zenyatta and Ballard plan to build components and further test these in fuel cells.
Dr. Rajesh Bashyam, Senior Research Scientist, R&D for Ballard stated:
Thermogravimetric Analysis (TGA) results showed that all Albany graphite samples had high thermal stability under the Ballard standard TGA protocol. Under this protocol most forms of graphite undergo complete thermal decomposition at around 860°C to lose all carbon. On the other hand, Zenyatta’s Albany graphite samples only lost 60 – 65% even at 1000°C. The detailed investigation clearly indicated that the Albany graphite exhibits excellent thermal stability and this can be used advantageously in the sub-components of fuel cells, in particular as the gas diffusion layer material. Also, corrosion resistance is an important requirement for an electrically conductive material like graphite used as a component material in fuel cells. Our testing results revealed that Zenyatta graphite samples of a certain particle size were found to be more corrosion resistant than typical graphite.”
Dr. Bharat Chahar, VP of Market Development for Zenyatta stated:
We are very pleased with these results from the Ballard testing. The purity and particle size of the Albany graphite material provided was already in the range needed for fuel cell applications, and therefore no further milling or purification was needed. Due to simple mineralogy, high crystallinity and desirable particle size distribution, Zenyatta’s Albany graphite has shown first screening specification ranges needed for the hydrogen fuel cell components. While further tests are ongoing to verify other performance characteristics, this initial feedback on results is extremely encouraging and quite promising for our upcoming advanced testing.”
Zenyatta commenced a market development program several months ago to initiate validation of Albany graphite in high purity graphite applications. Since the start of this program, the company has had detailed conversations with more than 35 graphite end-users, academic labs and third party testing facilities in Europe, North America and Asia under confidentiality agreements. Many of these organizations requested a specified amount of purified Albany graphite produced at the SGS site during the development of a process flow sheet. The samples produced at SGS are experimental in nature and may differ slightly from batch to batch and may also differ from the final product in the future. However, these samples are representative of the product that could be processed and provide a good initial assessment and guidance for the potential of Albany graphite for various applications.
Editor’s Note: This article covers one or more stocks trading at less than $1 per share and/or with less than a $100 million market cap. Please be aware of the risks associated with these stocks.